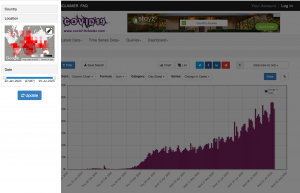
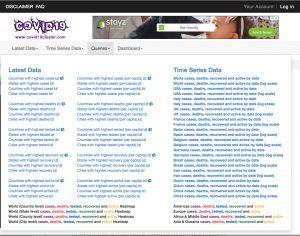
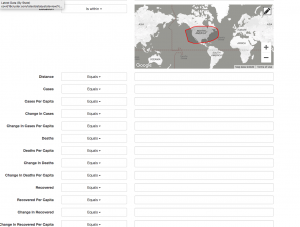
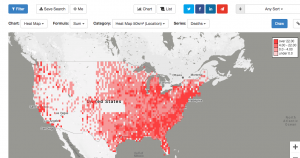
New York City, New York Aug 2, 2020 (Issuewire.com) - Release of a new dashboard www.covid19cluster.com containing COVID-19 data sourced from Government websites around the world. The site allows you to visualize Covid19 metrics in a variety of charts that can be filtered and searched by various parameters including by distance if you input your location. The dashboard compares geographic regions based on a selected metric on a chloropleth Google Map which may be zoomed and panned to restrict the comparison. The filter includes Draw-a-search functionality to select/lasso specific geographic areas including complex polygons. The site has a drop-down menu containing a number of pre-built queries and you can save your searches and re-use them across devices if you register.Charts can be embedded within your website - build your own dashboard!
Media Contact
Paul support@covid19cluster.com http://www.covid19cluster.com


